
Case study / tr3n.do
Market context across
Crypto, Stocks & Forex.
Trends, volume, events and market structure — without the noise.
Explore tr3n.do (opens in a new tab)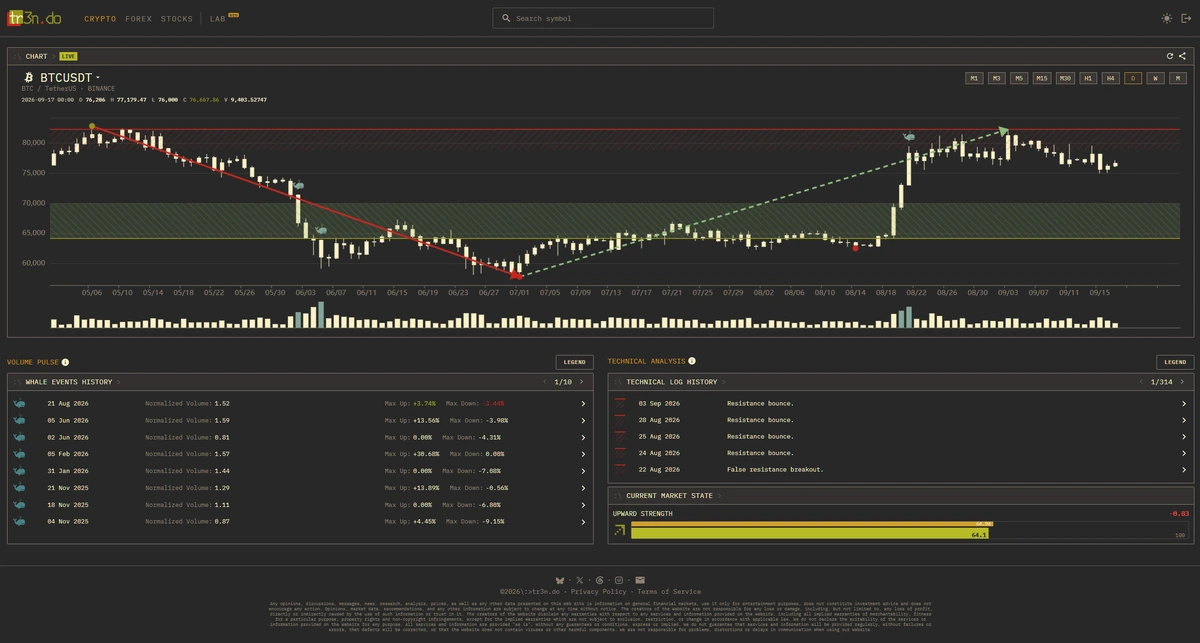
- Project
- In-house product
- Markets
- Crypto · Stocks · Forex
- Core stack
- C# / .NET · Blazor · QuestDB
The idea
A price move needs context.
A move in price is one observation. The trend around it, the level it meets, and the volume recorded alongside it add the context. tr3n.do brings those details into the same view.
The product
Three markets. One way to explore.
Pick an instrument and timeframe. Read its price chart alongside Volume Pulse, the technical log, and current market state. The same approach carries across Crypto, Stocks and Forex.
Trends
Follow uptrends, downtrends, and corrections across timeframes.
Volume
Put unusual activity alongside the price move and its history.
Events
Revisit tests, bounces, and breakouts through the technical log.
Structure
Read support, resistance, and buyer/seller zones in the chart.
Inside the work
The work behind
the market view.
The focused interface rests on connected market feeds, calculations, and a history that can be revisited.
- Back to the event
- The technical log records tests, bounces, breakouts, trend changes, and corrections. Selecting a recorded event opens the chart with the market structure captured at that moment.
- Volume in perspective
- Volume Pulse brings normalized volume and unusual-volume events into the view. Its history stays connected to the chart, so an event can be inspected where it happened.
- Connected underneath
- Binance, Alpaca and OANDA integrations feed the collection pipeline. Separate workers calculate structure and volume; historical backfills and versioned results support the public Blazor views.
The result
Context that carries through.
Price, trend, volume and event history share the same screen. The calculated context also feeds chart previews and publications. Built in-house by i-feature, tr3n.do connects the work behind the data with the way people explore it.
See the product (opens in a new tab)Next case study
i-feature machining
Less setup. More engineering.